ICP Definition Using Behavioral and Firmographic Signals
Layer behavioral and intent signals with company basics to target accounts actually ready to buy.
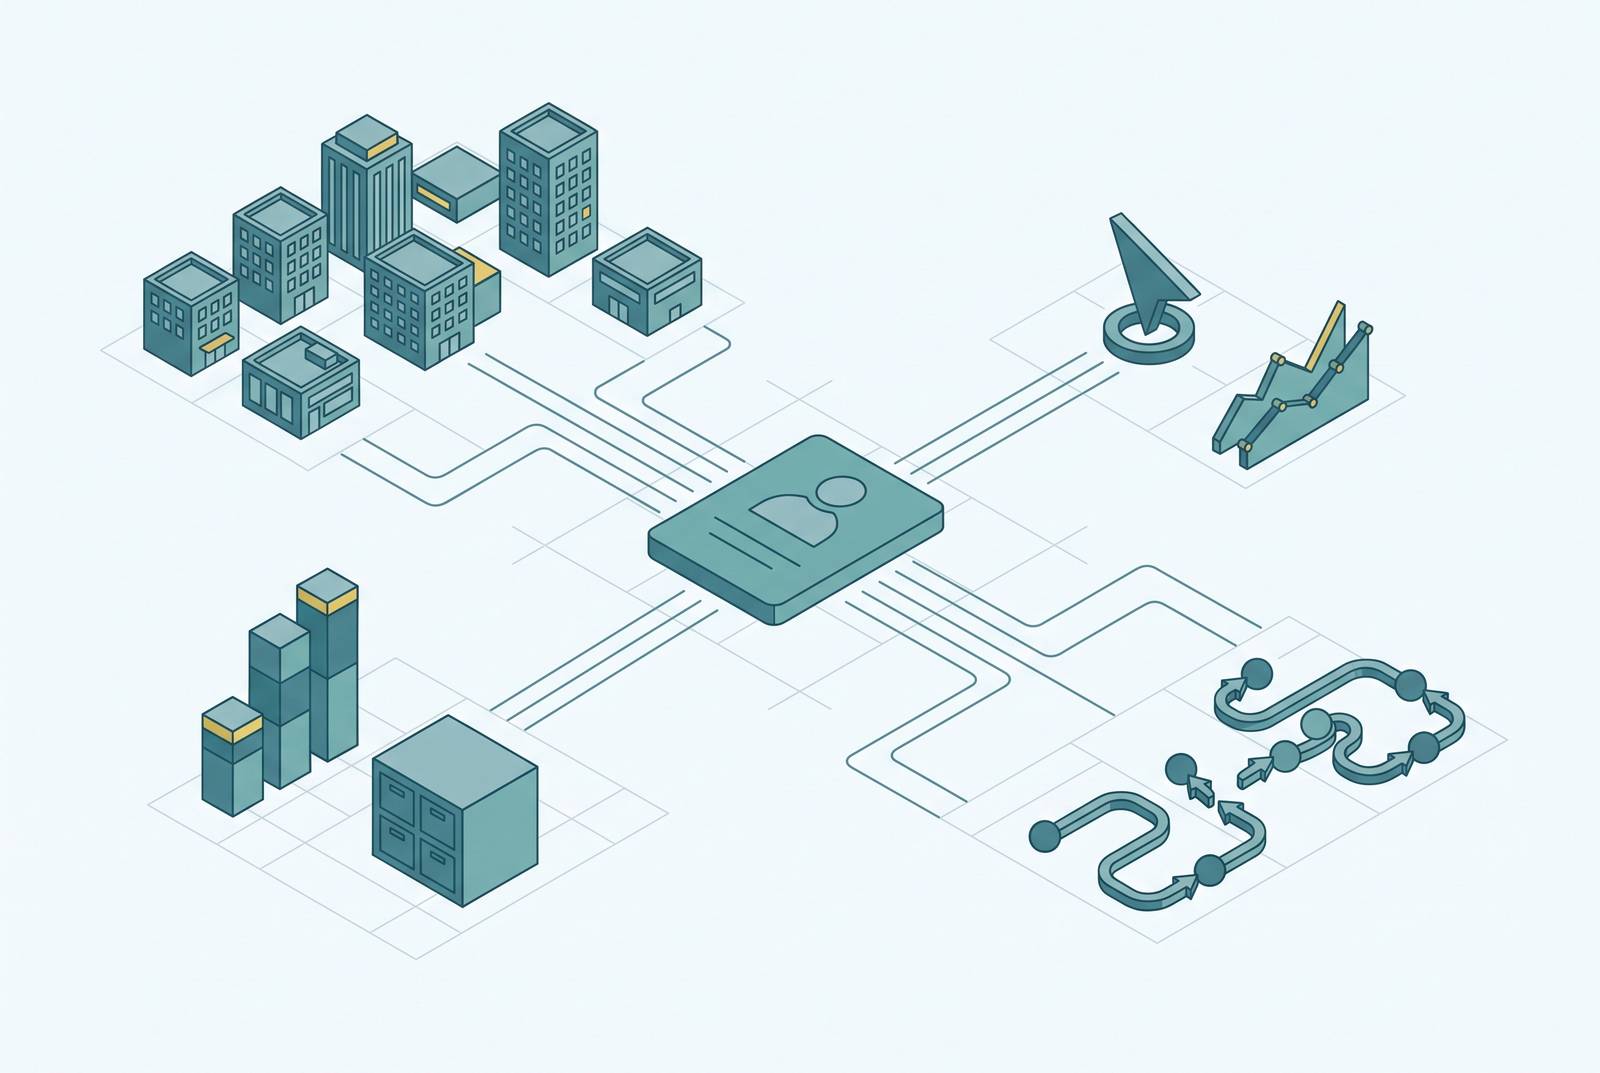
Most companies build their ICP backwards. They spend weeks on buyer personas, then bolt a firmographic filter onto the front of the funnel and call it targeting. That order is wrong, and it explains why so many outbound lists convert at rates that would get a paid channel shut down in any other context. An ICP is a data-driven description of the organizations most likely to buy a product, succeed with it, and expand their spend over time. It operates at the account level, not the individual level, and it is neither a buyer persona nor a target market description dressed up in a spreadsheet.
Confusing the two costs real pipeline. A buyer persona tells a rep how to talk to someone once that person picks up the phone: their title, their priorities, the language that lands. An ICP tells the rep whether that person's company belongs on the list. Persona work answers how to talk to this person. ICP work answers whether the company is worth talking to at all, and that second question has to get settled before the first one means anything.
Most teams go wrong quietly enough that nobody notices until the pipeline numbers come in. They build three or four detailed personas, complete with pain points and messaging angles, then skip the harder work of defining which companies those personas actually belong to. A VP of Sales at a 40-person seed-stage startup gets the same outbound sequence as a VP of Sales at a 5,000-person public company, because the title matched even though nothing about the company did. The persona work was fine. The company-level filter never happened.
Firmographics are where ICP work usually starts: industry vertical, company size, revenue band, geography, growth stage, funding status, legal structure. These are the fields sitting in any enrichment tool, cheap to pull and easy to filter on. But firmographics describe structural fit and nothing more. They tell you whether a company could plausibly use the product. They say nothing about whether that company is ready to buy it, actively evaluating alternatives, or sitting on a budget line that opens up in six weeks. A list built on firmographics alone is a list of companies that resemble past customers, and resemblance is not the same thing as readiness. Treating those two lists as identical is the single most common reason ICP definitions produce large lists and low win rates.
Signal stacking narrows the target to accounts that will buy
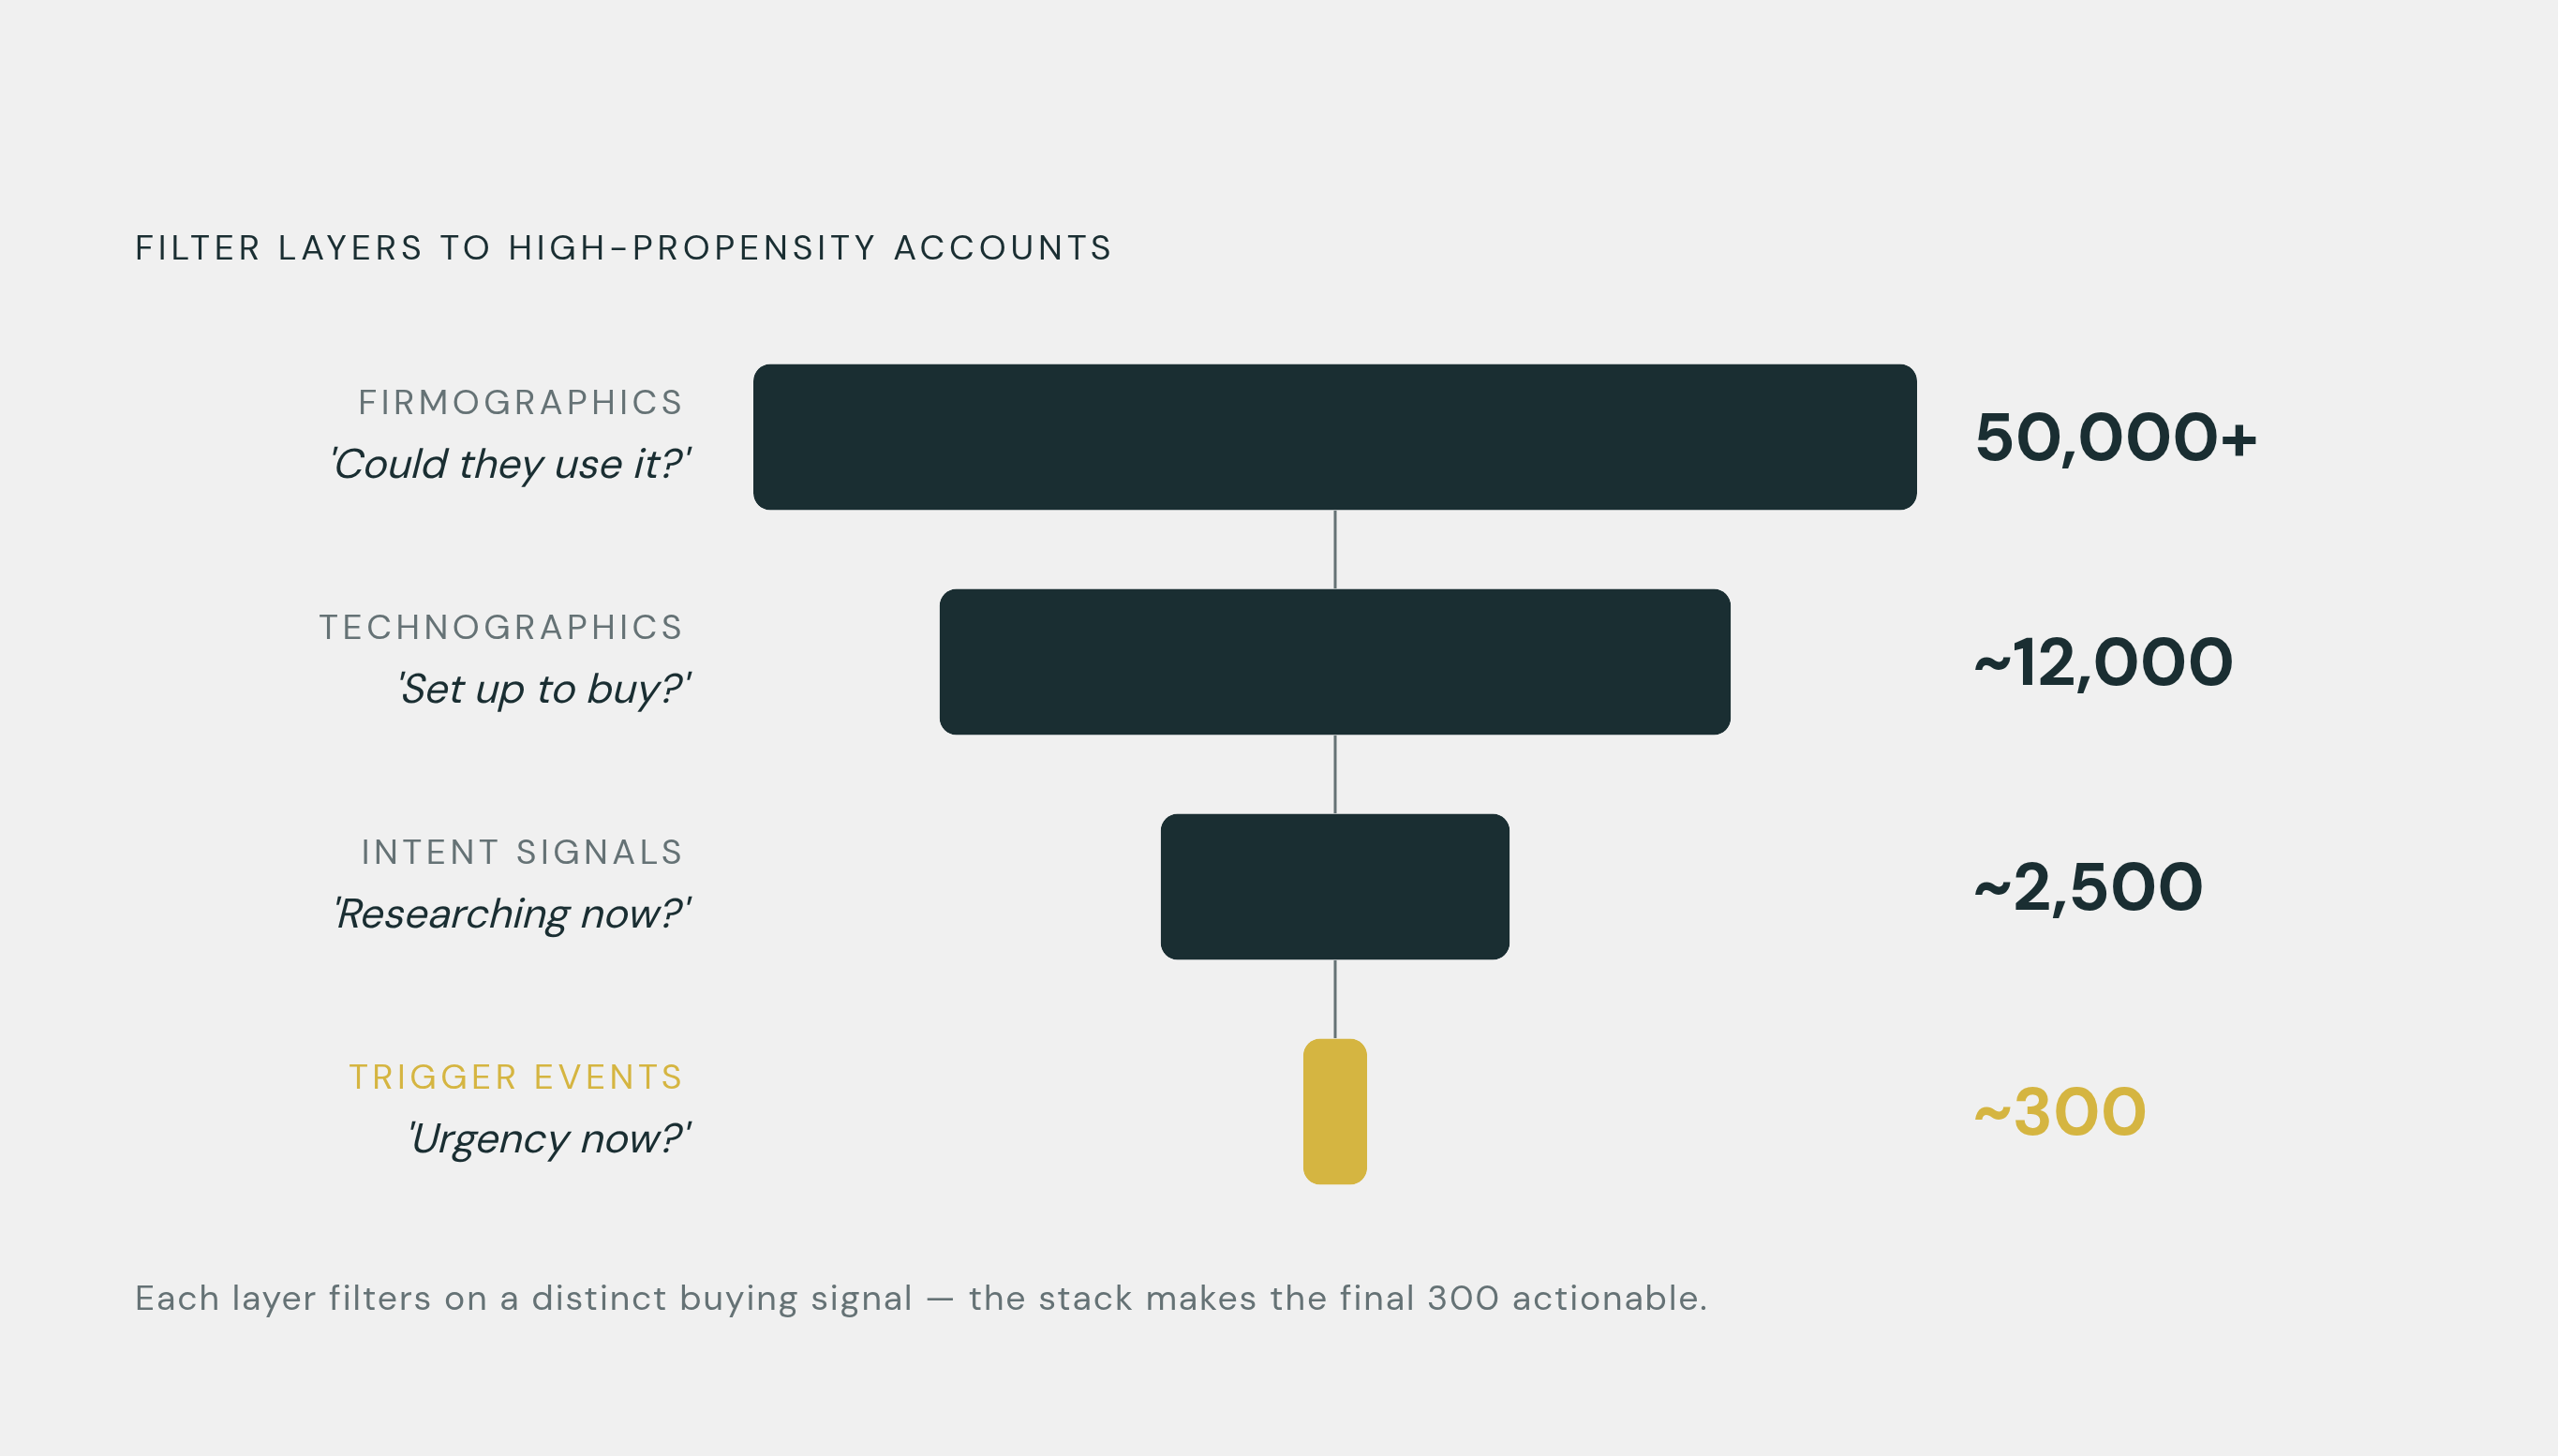
Signal stacking layers a firmographic base with technographic data, behavioral or intent signals, and trigger events, so a starting universe of tens of thousands of accounts collapses down to a few hundred with real buying propensity.
Take a concrete case. Start with mid-market SaaS companies, a wide employee-count range, one regional market. Add a technographic filter: the account runs a competitor's product in its stack. Layer in intent data: research activity is surging on a topic cluster tied to the product category. Add one more trigger: the account hired a VP of Sales or Marketing in the last 90 days. That combination shrinks the universe from tens of thousands down to a few hundred accounts where outbound and account-based marketing actually pay back, rather than a few hundred accounts that happen to convert out of tens of thousands by chance.
Each layer answers a different question. Firmographics answer whether a company could use the product. Technographics answer whether it's operationally set up to buy it. Intent signals answer whether anyone there is researching it right now. Trigger events answer whether something changed recently enough to create urgency.
Timing is the piece firmographics can never supply, and research from the Ehrenberg-Bass Institute on B2B buying cycles explains why that gap costs so much. Their work finds that as much as 95% of businesses aren't in the market for a given product at any one time, with only around 5% actively buying within a given quarter. A firmographic-only list can't tell you which 5% you're looking at. Every account on the list looks equally viable, and equally viable, in practice, means equally unlikely to pick up the phone.
Firmographics as the foundation layer
The core fields are familiar to anyone who's worked a CRM: employee count, revenue band, industry classification (SIC or NAICS codes, or a vendor's own taxonomy), geography, legal structure, founding year, growth stage, funding status including the size and timing of the last round.
None of it is exotic, and that's exactly the problem. Third-party firmographic data powers targeting for 88% of B2B marketers, which makes it standard infrastructure rather than an edge. A targeting strategy that stops at firmographics is doing what nearly every other B2B company already does, and it gets the results that approach reliably produces: big lists, thin conversion.
Size and growth stage determine budget authority, procurement process, and buying committee structure far more than industry classification does. A 50-person startup and a 5,000-employee enterprise selling into the same "software" vertical share almost nothing: different budget authority, different procurement, different pain points, different timelines. Grouping them under one industry tag and calling it an ICP erases the variable that actually predicts deal behavior.
Company size predicts something else too: how many people have to sign off before a deal closes. Organizations with more than 1,000 employees involve an average of 7.2 decision-makers in B2B purchases, as of 2026. That number alone should reset expectations for sales cycle length before a single conversation happens. Firmographic data is a forecast for how hard the deal will be to close once targeting is done. It is nothing more than that, and treating it as anything more is where the trouble starts.
Technographics as the second layer: using tech stack to identify operational readiness
Firmographics tell a team who could plausibly buy. Technographics tell a team which of those companies are actually set up to buy right now. For most B2B SaaS products, an ICP built on firmographics alone won't generate lists that convert at an acceptable rate, and pretending otherwise is how teams end up chasing accounts that were never close to ready.
The specific tools sitting in a company's stack carry information most teams underweight. The CRM platform a company runs signals how sophisticated the sales org is and what integration work a new tool will require. Sales engagement platforms like Outreach or Salesloft mean the company already runs a structured outbound motion and has already budgeted for sales tooling generally. Marketing automation presence is a rough proxy for marketing budget and operational maturity. Data warehouse or BI tooling signals a company comfortable investing in data infrastructure, and likely to value integrations that plug into it.
Two more signals cut in opposite directions. An account with no direct competitor product in its stack represents a clean-slate opportunity with no incumbent to displace. An account already running complementary tools suggests smoother integration and a live problem the new product solves immediately, rather than one that has to get manufactured through education.
Competitive displacement deserves its own callout, because sales teams routinely get this backwards. "They already use a competitor" gets treated as a disqualifier when it should be read as the strongest possible buy signal available. If a competitor's product sits in the stack, the account has already cleared the internal hurdle of budgeting for the category and has an active, acknowledged problem the category solves. That account should get prioritized over a clean-slate prospect who's never budgeted for anything like it. Passing it over because a competitor got there first inverts the logic of the signal.
For most SaaS products, specific technographic signals such as CRM platform, data warehouse presence, or the absence of a direct competitor tool correlate more strongly with fast, clean closes than any single firmographic variable does on its own.
Behavioral signals and intent data as the third layer: finding accounts in an active buying window
B2B buying signals are observable events showing a company is moving toward a purchase decision, such as a demo request, a funding announcement, a new executive hire, or a sudden spike in research activity around a category.
The industry uses "intent data" and "signals" interchangeably, and that habit is sloppy, because the distinction carries operational consequences. A vendor assigns a number to intent data, typically based on a company visiting a certain page or a topic surging in its research activity. A signal carries context, such as a company posting a new job requisition, a CEO mentioning an initiative on an earnings call, or a direct competitor closing a funding round. Signals tell a story. Intent data quantifies a pattern. A scoring model that leans on only one of the two will miss half the picture, no matter how well-tuned the weights are on the half it keeps.
Intent data itself comes in three grades, and they are not interchangeable. First-party data, pulled from a company's own website and product usage, carries the highest fidelity because it's owned directly and reflects real interaction with the product. Second-party data, sourced from review platforms like G2 or content syndication partners, tends to capture buyers who are already actively evaluating options. Third-party data, aggregated across the web by platforms like Bombora, which tracks topic surges, offers the broadest coverage and tends to catch companies earlier, before they've shown up on anyone's own site.
Trigger events layered on top of intent data are where urgency actually gets identified. A completed funding round opens the highest-urgency window for stack evaluation, typically the six months that follow, as new capital gets allocated and old vendor relationships get re-examined. A new executive hire often triggers a tool audit, since new leaders arrive with their own preferences and the authority to act on them. A champion changing jobs, someone who advocated for a product at a previous company landing somewhere new with budget, is a particularly valuable signal in B2B, because it pairs a warm relationship with a fresh opportunity. Contract renewal windows, whether for an incumbent product or a competitor's, create natural evaluation points. Organizational restructuring or M&A activity disrupts existing vendor relationships and forces a fresh look at the whole stack.
The adoption gap: most teams collect intent signals but don't act on them well
Collection isn't the bottleneck anymore. Only 13% of B2B teams skip intent signals entirely, so the infrastructure for gathering this data is close to universal at this point.
Acting on what's collected is a different story, and this is where most programs actually fall apart. Just 43% of teams adjust their messaging to reflect the specific interests a signal reveals, and 44% do little more than route the signal straight to a rep's inbox with no interpretation attached. That's alert-forwarding, not intelligence, and it wastes the whole point of collecting the data.
The value in a stacked signal never comes from any single data point. It comes from combining several and reading what they mean together. A funding round plus a new VP hire plus a competitor's tool in the stack tells a different story than any one of those facts alone. A rep who gets a bare notification that "Company X visited the pricing page" has almost nothing to work with. A rep who gets that notification alongside the fact that Company X just closed a funding round and runs a competitor's product has an actual opening line, and those two reps' close rates diverge sharply, which is the whole argument for stacking in one sentence.
A second problem compounds the first: data goes stale fast. Contact data decay runs at roughly 30% by industry baseline estimates, so a meaningful share of any enrichment database is already wrong within a year. AI-native enrichment tools are compressing that staleness window from quarters down to weeks, which helps, but a scoring model still running on three-month-old data will keep recommending outbound to accounts whose situation has already moved on. A trigger event has a shelf life. Acting on it late costs almost as much as not acting on it.
Building an ICP scoring model that operationalizes signal stacking
The starting data source matters as much as the model built on top of it. Pull the closed-won accounts, then filter for retention, expansion rate, time-to-value, and support cost. A company that churns in month four looks identical to a company that expands three times over in a raw "closed-won" list, and only the deeper metrics tell them apart. Skipping this step means training a model on the wrong definition of success before the model does anything.
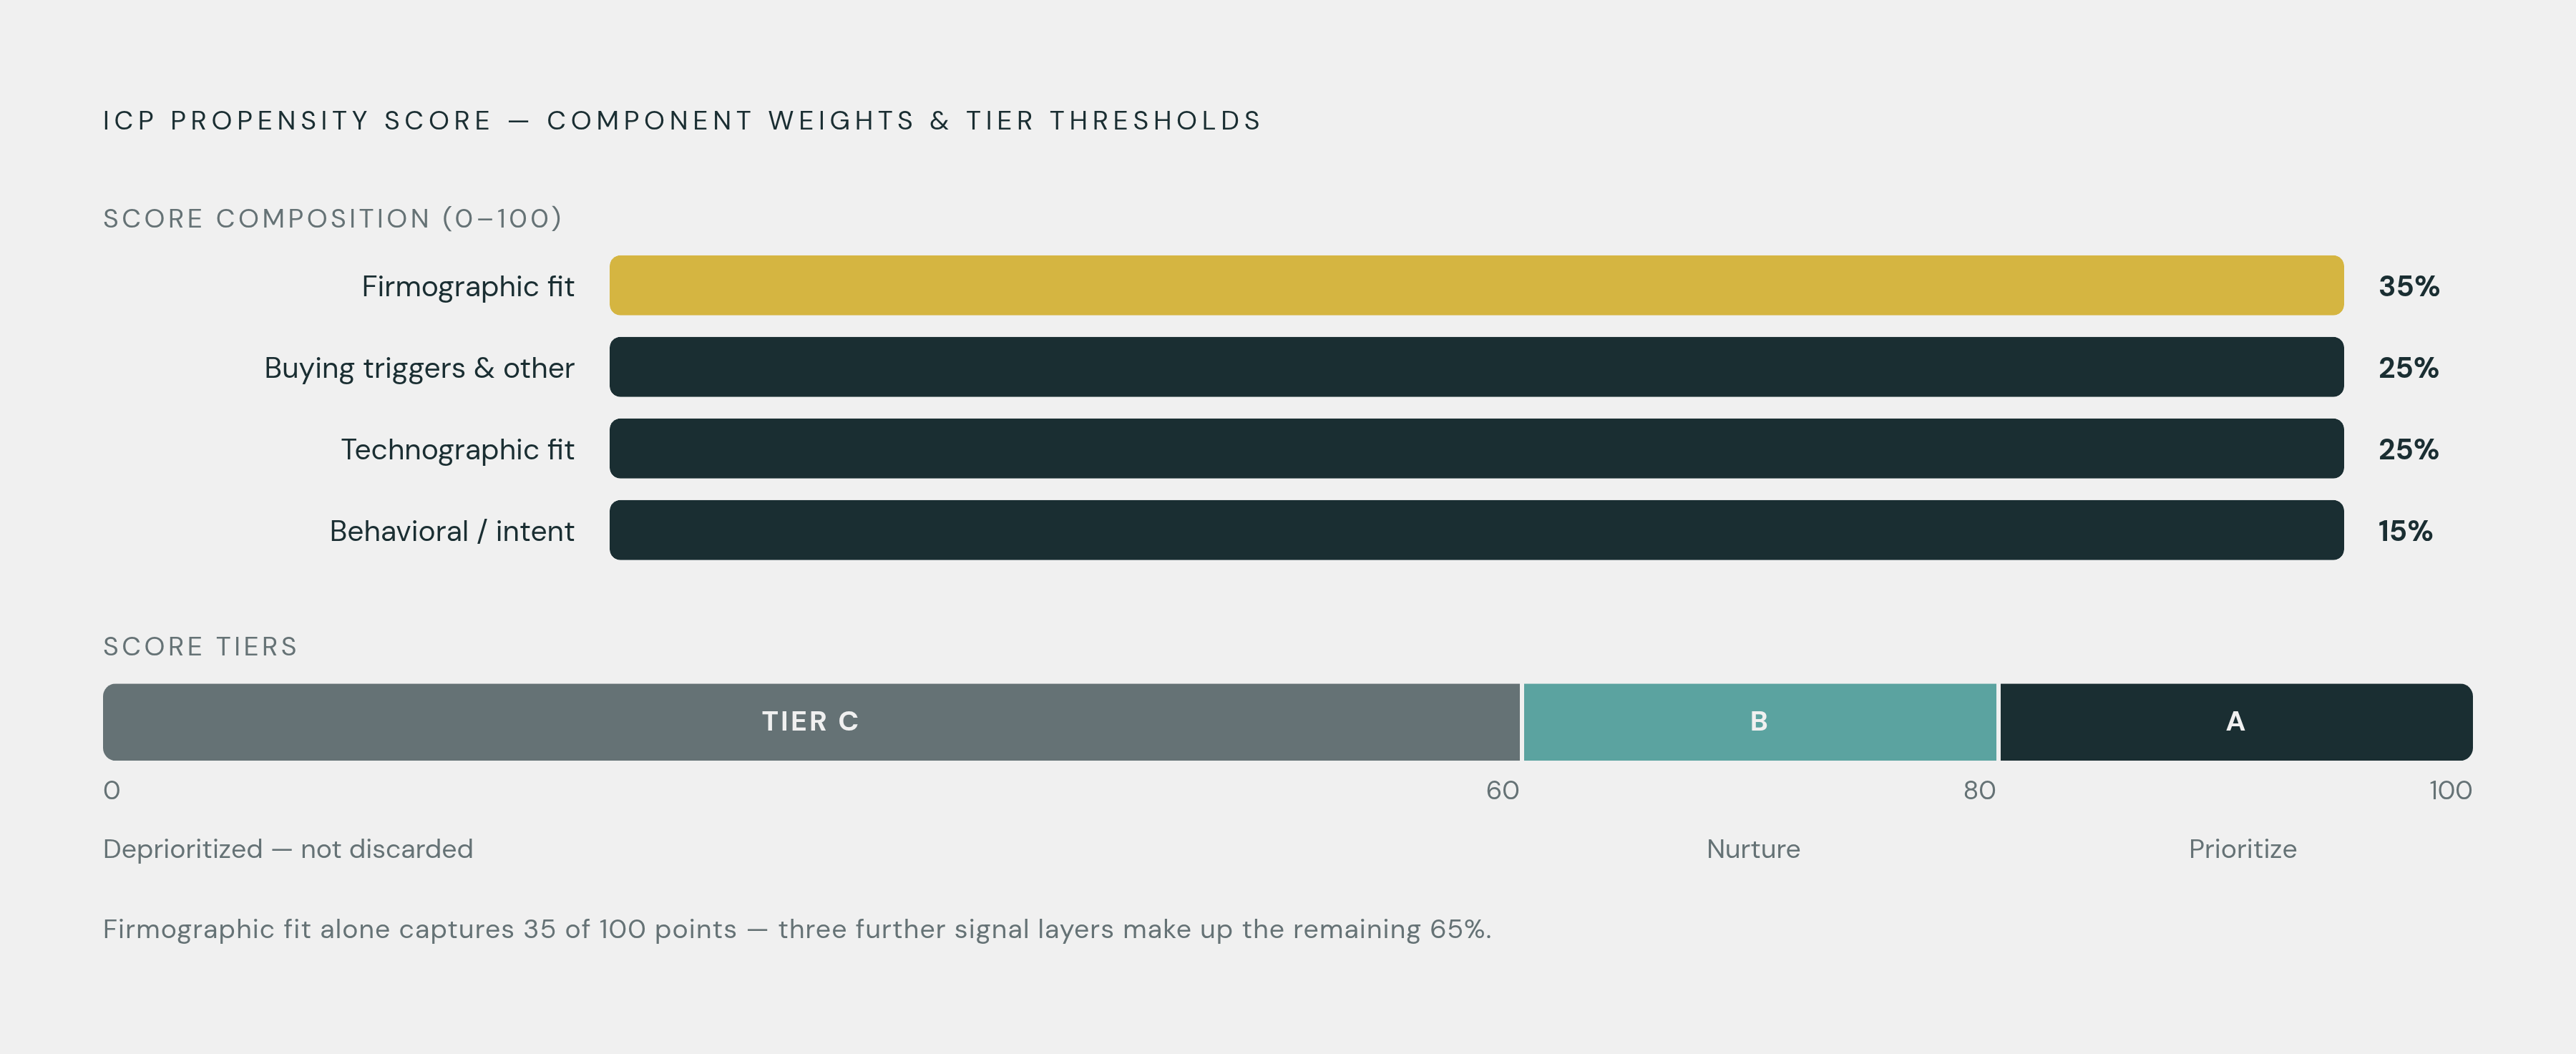
From there, a weighted scoring model gives the four signal layers a defensible structure. A reasonable starting allocation draws from published rubrics: firmographic fit at 35%, technographic fit at 25%, behavioral signals at 15%, with the remaining weight distributed across buying triggers and other factors based on your sales motion. Scored on a 0 to 100 scale, this produces a ranked list instead of a binary yes or no, and that ranking matters because sales and marketing resources should scale with propensity, not get spread evenly across every account that clears some minimum bar.
A more granular version expands to seven criteria: firmographic fit, technographic overlap, intent signals, engagement activity, buying triggers, economic outcome (what the account is likely to spend and retain over time), and negative disqualifiers (traits that should exclude an account regardless of how well it scores elsewhere). Accounts scoring 80 or above are Tier A. Scores between 60 and 79 are Tier B. Anything under 60 is Tier C, deprioritized rather than discarded.
None of these weights should be treated as fixed. They need calibration against 12 months of closed-won and closed-lost data to confirm they actually predict outcomes for a given business, and they need recalibration every quarter, because shifts in the product, the market, and the competitive landscape drive changes in what the weights should be, and constant tracking of those shifts is how teams know recalibration is necessary.
Tools that supply the signals: intent data platforms and enrichment infrastructure
The signals described above don't collect themselves. A market of vendors exists specifically to supply each layer. Third-party intent aggregators like Bombora and Bombora tracks topic surges across the web, giving teams visibility into research activity happening outside their own site. Firmographic and technographic enrichment tools fill in the structural data, employee counts, revenue bands, tech stack composition, that firms need to build the base layer and the second layer of the stack. Review platforms like G2 are identified as second-party intent data sources, capturing signals from buyers who engage with reviews and comparisons.
None of these tools substitutes for the scoring model itself, and treating vendor data as a finished answer is its own mistake, arguably the more expensive one of the two. Vendors supply raw material. The work of stacking that material into something that actually predicts which accounts will buy, succeed, and expand still belongs to the team building the ICP. No vendor can automate away the judgment calls that go into weighting one signal against another, because those calls depend on a specific product, a specific market, and a specific definition of what winning the account actually looks like.